
Data center support: which protections deserve a local test?
Eleven modeled proposals show how support differs with bill protection, physical impact and enforceable commitments. Use the results to prepare a deliverable package for local resident research.

In Vensia’s modeled study, an ordinary data center proposal near homes averaged 8.9% predicted support. A complete package with lower physical impact, protected household bills, community benefits and guarantees reached 37.6%. The 28.7-percentage-point gap suggests a practical question for a project team: which protections deserve a local resident test?
The study placed a hypothetical 100-acre, 100-megawatt data center one mile from homes. It would use about 500,000 gallons of water a day and promise 50 permanent jobs and $20 million in annual local property taxes. Vensia tested eleven versions with 10,000 synthetic U.S. residents; different groups evaluated each proposal. Support figures are mean predicted probabilities, while payment reactions are selected answers. Some follow-up bases and uncertainty intervals are not supplied here.
The comparisons suggest a development sequence to investigate: protect bills, reduce the project’s physical impact, make guarantees enforceable and tailor the proposal to local concerns. They do not establish that this order will work for a real site.
Cash alone was close to the baseline
A $100 monthly payment offer averaged 9.3% predicted support, compared with 8.9% for the ordinary offer. Among those offered cash, 37.4% said they would take it and still oppose the project; 27.6% called the payment a bribe or hush money. The cash offer left the household-cost concern in place.
In the cash-only group, 51.1% chose about $500 a month when asked what amount would feel fair, while 16.9% said no amount would. That measured perceived fairness; Vensia did not test whether a $500 offer would increase support.
Vensia also asked where residents wanted the money to go. 53.3% preferred fixing the underlying problem, 35.5% chose credits on everyone’s electricity bill, and 1.1% chose equal household checks. The answers pointed to cost protection rather than a larger check.
The offer pairing the $100 payment with bill protection averaged 16.4% predicted support, compared with 9.3% for payment alone. The share calling it a bribe or hush money was 10.1% in the protected-offer group.
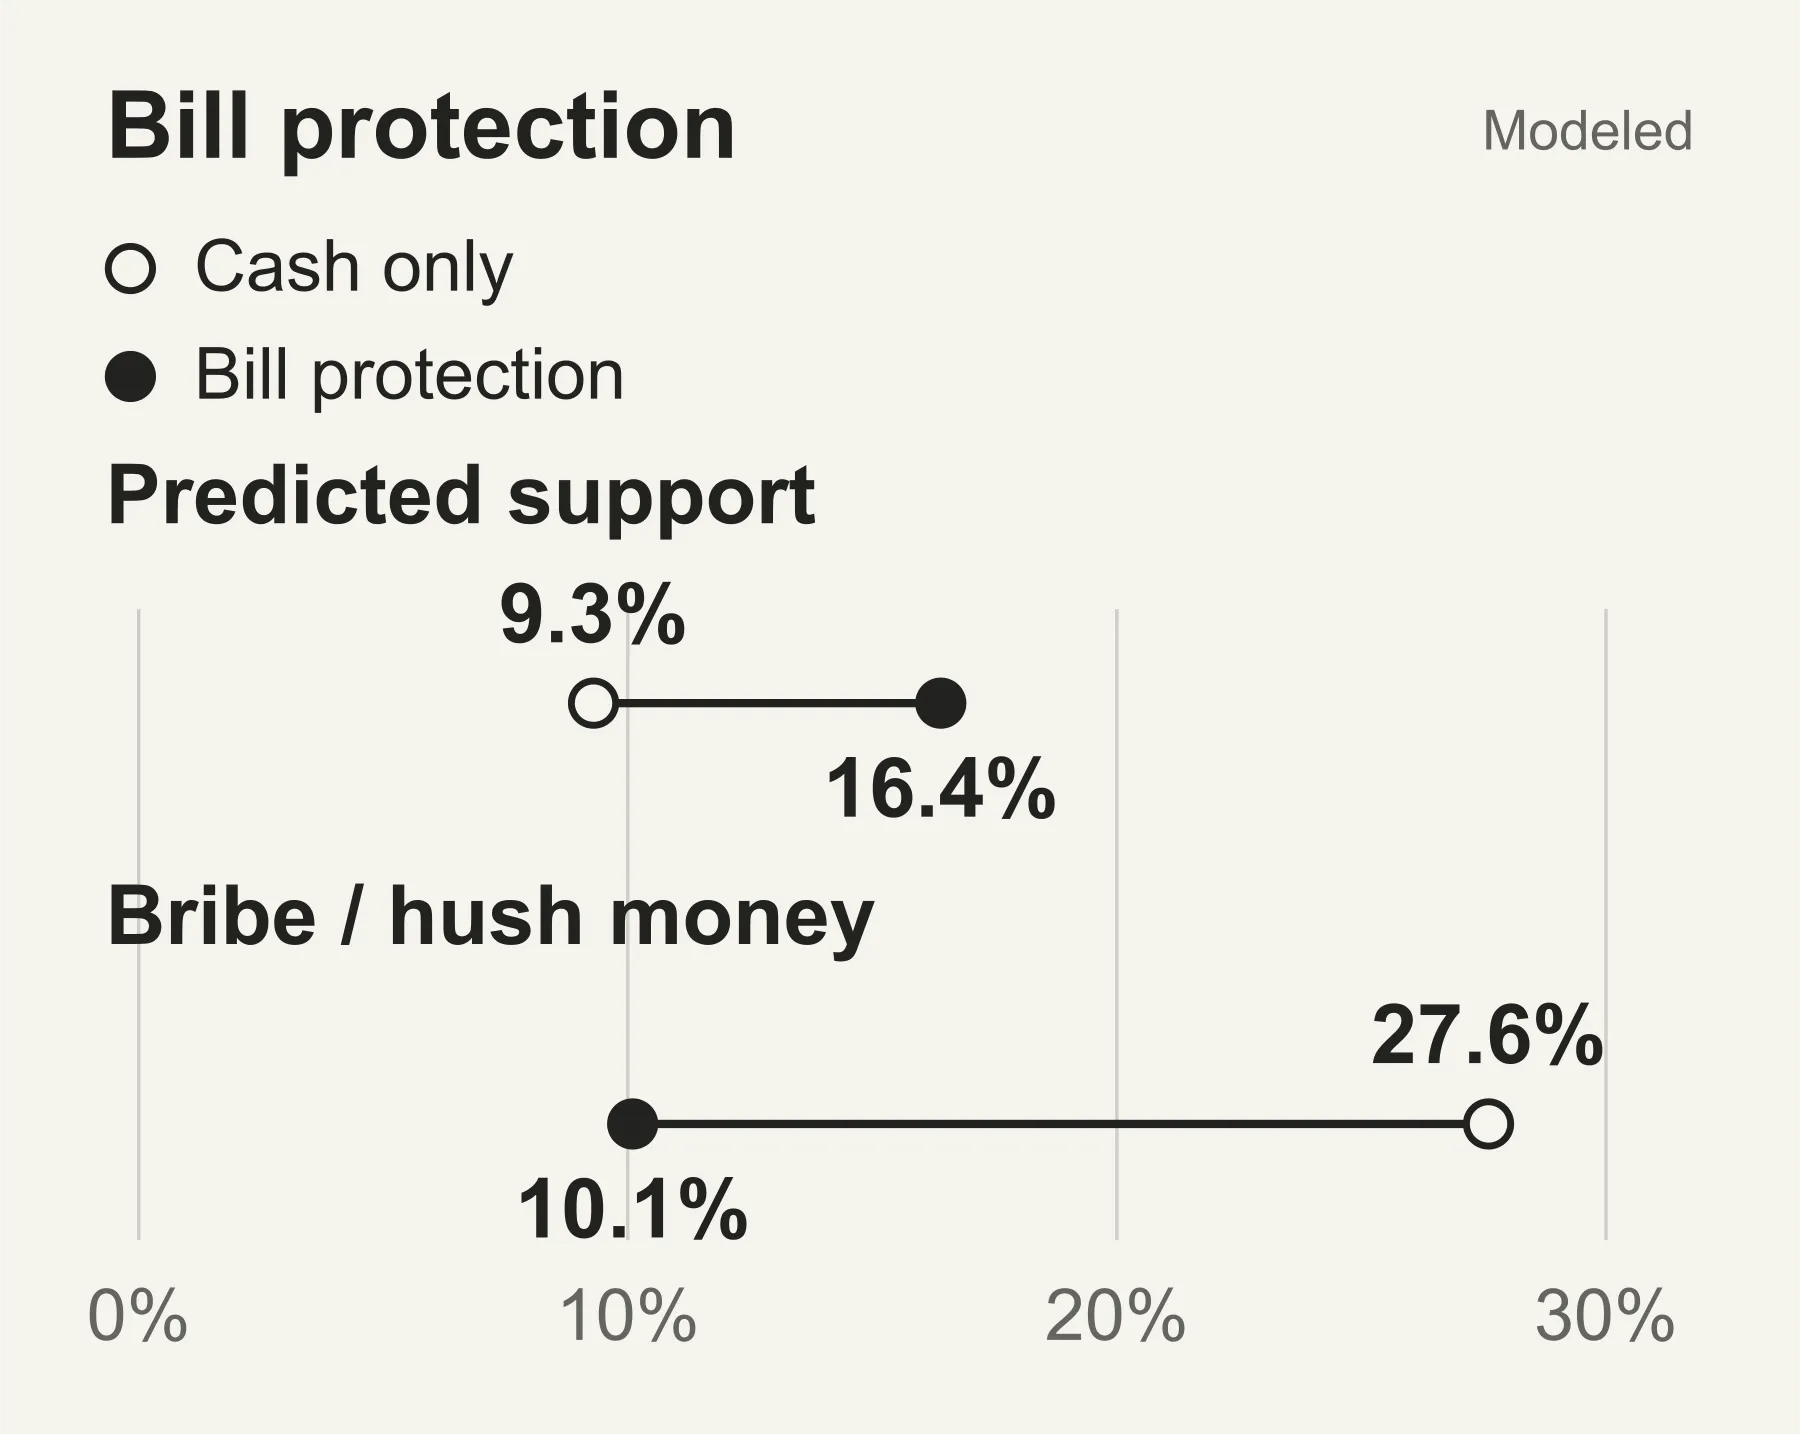
Separate groups evaluated cash alone (n=903) and cash with bill protection (n=910). Keep those independent offer groups visible when comparing their support and payment reactions.
For the next offer test, compare cash alone with a payment that also protects households against higher electricity bills. The study suggests that difference is worth investigating locally.
Reduce the project’s impact
Vensia found two leading concerns with the ordinary proposal: electricity bills (52.4%) and water (41.2%). With bill protection, water became the top concern (78.4%). With lower water use, noise and site impact, electricity bills led (89.9%).

Each value is the share naming one biggest concern in its proposal group. Ordinary, bill-protection and lower-impact groups each had n=910; the complete-package group had n=909.
The lower-impact proposal averaged 20.3% predicted support, more than double the ordinary offer’s 8.9%. Separate groups evaluated each version, and the leading unresolved objection differed with the package.
Together, the results set up the complete offer: protect bills and make the physical project less burdensome.
The full offer leads by 28.7 percentage points
Vensia’s complete offer combined lower physical impact, bill protection, community benefits and guarantees. It averaged 37.6% predicted support, 39.3% opposition and 23.1% unsure. Support was 28.7 percentage points above the ordinary-offer group, bringing it close to opposition in the simulation.
Among respondents who supported the complete package, 46.7% named payments or protections as their main reason and 41.7% named what the money could do for local schools. The package addressed private costs and offered a visible community benefit.
Once the offer dealt with cost and impact, trust became the leading concern. 59.2% of the complete-package group chose belief in the promises as their biggest issue. Asked what would make guarantees credible, 88.9% chose an escrow arrangement that the developer would automatically lose if it failed to deliver. Vensia identified a concrete mechanism for the next offer test; its effect on support was not tested here.
The version with guarantees alone and the lower-impact version both reported 20.3% predicted support. Credibility still needs to be examined alongside a package that addresses bill and site concerns.
Local objections change the playbook
Vensia’s metro analysis showed full-package support ranging from 46.2% in Des Moines to 30.1% in Richmond. A national average would hide how differently the same offer landed.

Each metro comparison used 91 simulated profiles per offer.
Vensia also found different first objections. In the ordinary-offer groups, 97.8% of modeled Columbus respondents chose electricity bills as their biggest concern; 97.8% in modeled Phoenix chose water. The same proposal needs a different first answer in each place.
Vensia turns each metro’s leading concern into a starting question for local resident research. With 91 modeled profiles per offer in each metro, these are directional priorities for a field test, not citywide forecasts.
A local brief should specify commitments residents can check
Cash alone showed little difference in predicted support, while the lower-impact proposal had more than twice the ordinary offer’s support. The complete package brought support close to opposition and left trust as the leading concern. Use those contrasts to choose the protections, physical changes and enforcement terms a local study should examine.
Vensia can model an audience, compare specific propositions and examine the reasons behind each response. For a real site, the next step is to test the locally relevant package with residents and show how its commitments will be enforced.
Bring a concrete site proposal and the commitments you could deliver to Vensia. Compare modeled local concerns and offer responses to prepare the package you will test with residents.