
Demographic segmentation: use buyer context to shape the offer
Demographic segmentation describes groups through characteristics such as age, household composition or income. Use those fields when they change the offer, access or research design.
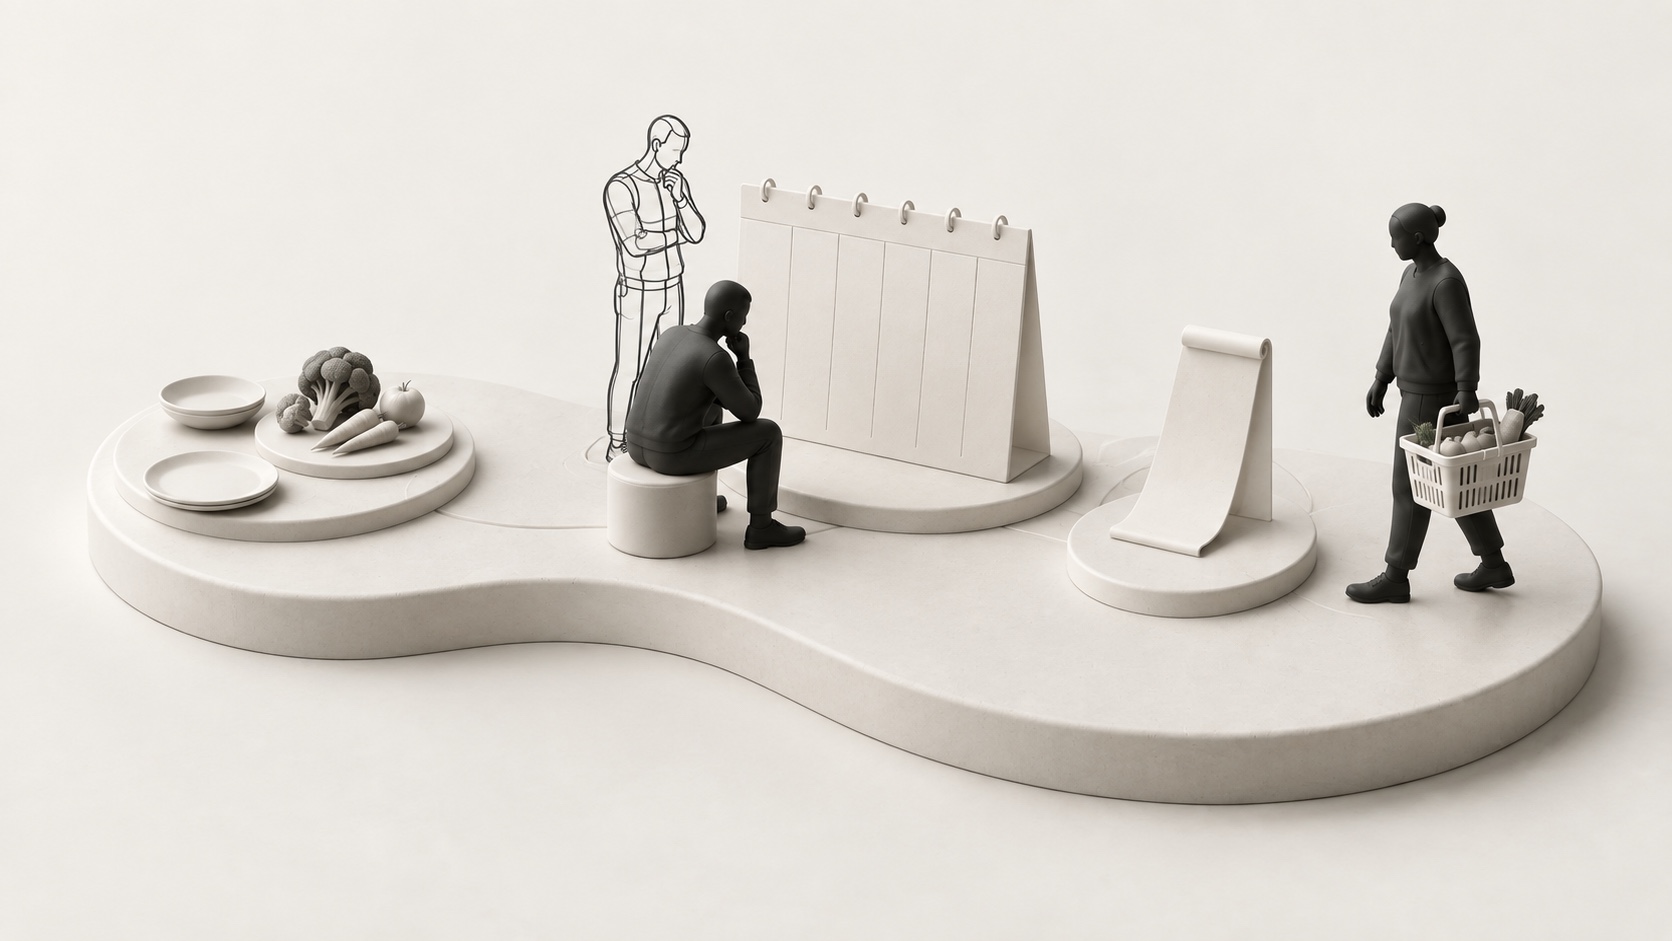
Demographic segmentation groups buyers by characteristics such as age, household composition or income. For a meal-planning service, those fields give context; the demonstration also needs to reflect how many people share dinner and what makes planning difficult.
Consider a meal planner choosing its first product demonstration for adults aged 25–34. In the illustrative group below, 100 adults split between those two needs. Keep age as audience context, then use the household and meal questions to learn which product explanation each person needs.
Demographic variables have different research jobs
Variable | Research purpose and design caution |
|---|---|
Age range | Possible research purpose: Category experience or eligibility context Design caution: Avoid treating age as a motivation |
Household composition | Possible research purpose: Who uses or shares the offer Design caution: Define household and relevant roles |
Income range | Possible research purpose: Affordability context Design caution: Allow nonresponse; currency and period must be clear |
Employment situation | Possible research purpose: Relevant daily occasion Design caution: Use understandable, nonoverlapping choices |
Location | Possible research purpose: Coverage and availability Design caution: Geography is not a demographic motive |
Use only fields necessary for the study and appropriate to collect. Define categories before analysis, preserving missing or declined answers. A person who declines an income question should not silently enter the lowest-income group.
One age band, two different product jobs
Among the 100 adults aged 25–34:
Adults | Product job and demonstration |
|---|---|
60 | Product job: Fewer daily dinner decisions Demonstration: Show a saved weekly plan |
40 | Product job: Better grocery organization Demonstration: Show the combined ingredient list |
The same demographic group contains two needs. The counts illustrate why the product job belongs beside the age description.
Use the exact household and shared-meal questions
For an adult respondent, ask: “Which describes the people who usually live in your household, including you?” Define usual residents as people who normally live at the address, excluding visitors. Options: one adult, no people under 18 (adult_alone); two or more adults, no people under 18 (adults_only); one adult and at least one person under 18 (one_adult_children); two or more adults and at least one person under 18 (adults_children); another arrangement (other); prefer not to answer (declined). Keep no answer as missing. These categories describe household composition; they do not explain needs.
Ask the following shared-meal question only of respondents who have had a main evening meal at home in the past four weeks. For others, record that the question is not applicable rather than forcing a quantity or treating non-eligibility as a missing answer.
Then check the relevant shared-use occasion. For a meal planner, one exact question is: “How many people, including you, usually share your main evening meal at home?” Define the reference period as a typical week in the past four weeks. Options: one person (code 1); two (2); three (3); four (4); five or more (5); varies too much to give a usual number (varies); prefer not to answer (declined). Keep no answer as missing.
This measures the relevant shared meal occasion, rather than assuming everyone resident in a household eats together. It could change whether you investigate shared planning and list quantities; it does not establish motivation. For a literal household-composition measure, define usual residents separately. Use our market segmentation guide to check whether the group is reachable and actionable.
One age band can need two demonstrations
The split gives you two messages to compare: a weekly plan that reduces daily choices for the 60 adults seeking planning relief, and one ingredient list from selected meals for the 40 seeking grocery organization. Prepare both demonstrations for the same service. A shared age band alone would have concealed the choice.
View an example study to inspect the audience, offer and findings before planning your own.
Keep the audience size beside the result
Show the eligible group size, valid answers and distributions. If you compare many age bands, income bands and household types, some subgroups may be too small for the decision. Avoid interpreting whichever percentage looks largest as a stable discovery.
When estimating population prevalence, the sampling and weighting design matters. Matching a few demographic proportions does not guarantee that all relevant attitudes or behaviors are represented.
Demographics work alongside decision variables
A buyer who already decides dinners but assembles ingredients manually needs to see list consolidation. A buyer who struggles to choose each evening needs to see the saved plan. Show the same actual workflow in the order that answers the problem, then check whether the explanation fits. A single age-targeted headline would conceal that choice.
Use demographic fields when they change eligibility, product use or a planned comparison. Keep declined and missing answers separate. If a difference disappears once category use or meal responsibility is considered, the useful campaign may concern that situation rather than the age group. Our psychographic segmentation guide explains how to investigate the motivations behind a choice.
Residents and shared meals are different variables
Before adapting quantities, compare the shared-meal answer with the resident description. A household with several residents does not guarantee one shared dinner. The table below assigns each field a job so the recipe demonstration does not assume a meal size the question never measured.
Need in the study | Relevant variable and its limits |
|---|---|
Describe who lives at the address | Relevant variable: Usual-resident composition What it does not establish: Who shares a meal or makes the decision |
Investigate recipe quantities | Relevant variable: Usual shared evening-meal count What it does not establish: Every resident’s preferences |
Investigate coordination | Relevant variable: Who chooses and shops What it does not establish: A motive inferred from age or household type |
Investigate affordability | Relevant variable: Defined budget/income context where needed What it does not establish: The value of a product to every person in that band |
The demonstration follows the product job
Suppose the launch team can prepare one first demonstration. If its intended buyers already plan dinners and need grocery organization, show selected recipes becoming a combined list at their usual meal quantity. If the target problem is repeated dinner choice, show saving and returning to the plan.
Add coordination only when the workflow needs it. Ask who chooses, who shops and who must see a change to the plan. If one person does all three, a shared-household biography may add little. If responsibilities differ, test whether the product and explanation pass information between them. That answer can change functionality as well as copy.
Give product the meal quantity and coordination task; give marketing the need and demonstration order. Retain age, household and missing states for context. The handoff earns its demographic detail because another team can say what it will do differently with each field.
Two meal-planner demonstrations to compare
Demographic grounding helps describe a modeled population, but does not by itself validate its responses. Request evidence relevant to the actual audience and decision. Generated group sizes must not be treated as independent human samples.
Vensia can compare modeled responses to the saved weekly plan and combined ingredient-list demonstrations across the relevant meal-planning groups. Use the exact household and shared-meal questions to describe context, then examine which workflow explains the service’s value and why.
Keep the age context, meal eligibility and every missing or declined state in the demonstration brief. Ask Vensia to compare the saved plan and combined list against the product decision each plausible finding would change.