
Brand perception map: choose the positioning test it suggests
A tea brand looks convenient but less premium than one alternative. Its map suggests a cue to test, while the ratings, audience bases and product facts determine what that test can tell you.

A brand perception map plots how buyers rate competing brands on selected attributes, helping you choose a positioning question to test. For Lumen, the fictional tea brand here, that question is whether a credible premium cue can strengthen its afternoon-treat appeal without losing convenience. The illustrative comparison with Harbor and Plainfield suggests a next test; empty space on the map doesn't establish demand.
Comparability starts with the question and base
Ratings and plot coordinates
Brand | Ratings and fixed-axis coordinates |
|---|---|
Lumen | Convenience mean: 4.2 Premium mean: 3.0 Valid convenience ratings: 100 Valid premium ratings: 100 Scale minimum / maximum: 1 / 5 Normalized convenience / premium: 0.8 / 0.5 |
Harbor | Convenience mean: 3.1 Premium mean: 4.4 Valid convenience ratings: 100 Valid premium ratings: 100 Scale minimum / maximum: 1 / 5 Normalized convenience / premium: 0.525 / 0.85 |
Plainfield | Convenience mean: 3.6 Premium mean: 2.8 Valid convenience ratings: 100 Valid premium ratings: 100 Scale minimum / maximum: 1 / 5 Normalized convenience / premium: 0.65 / 0.45 |
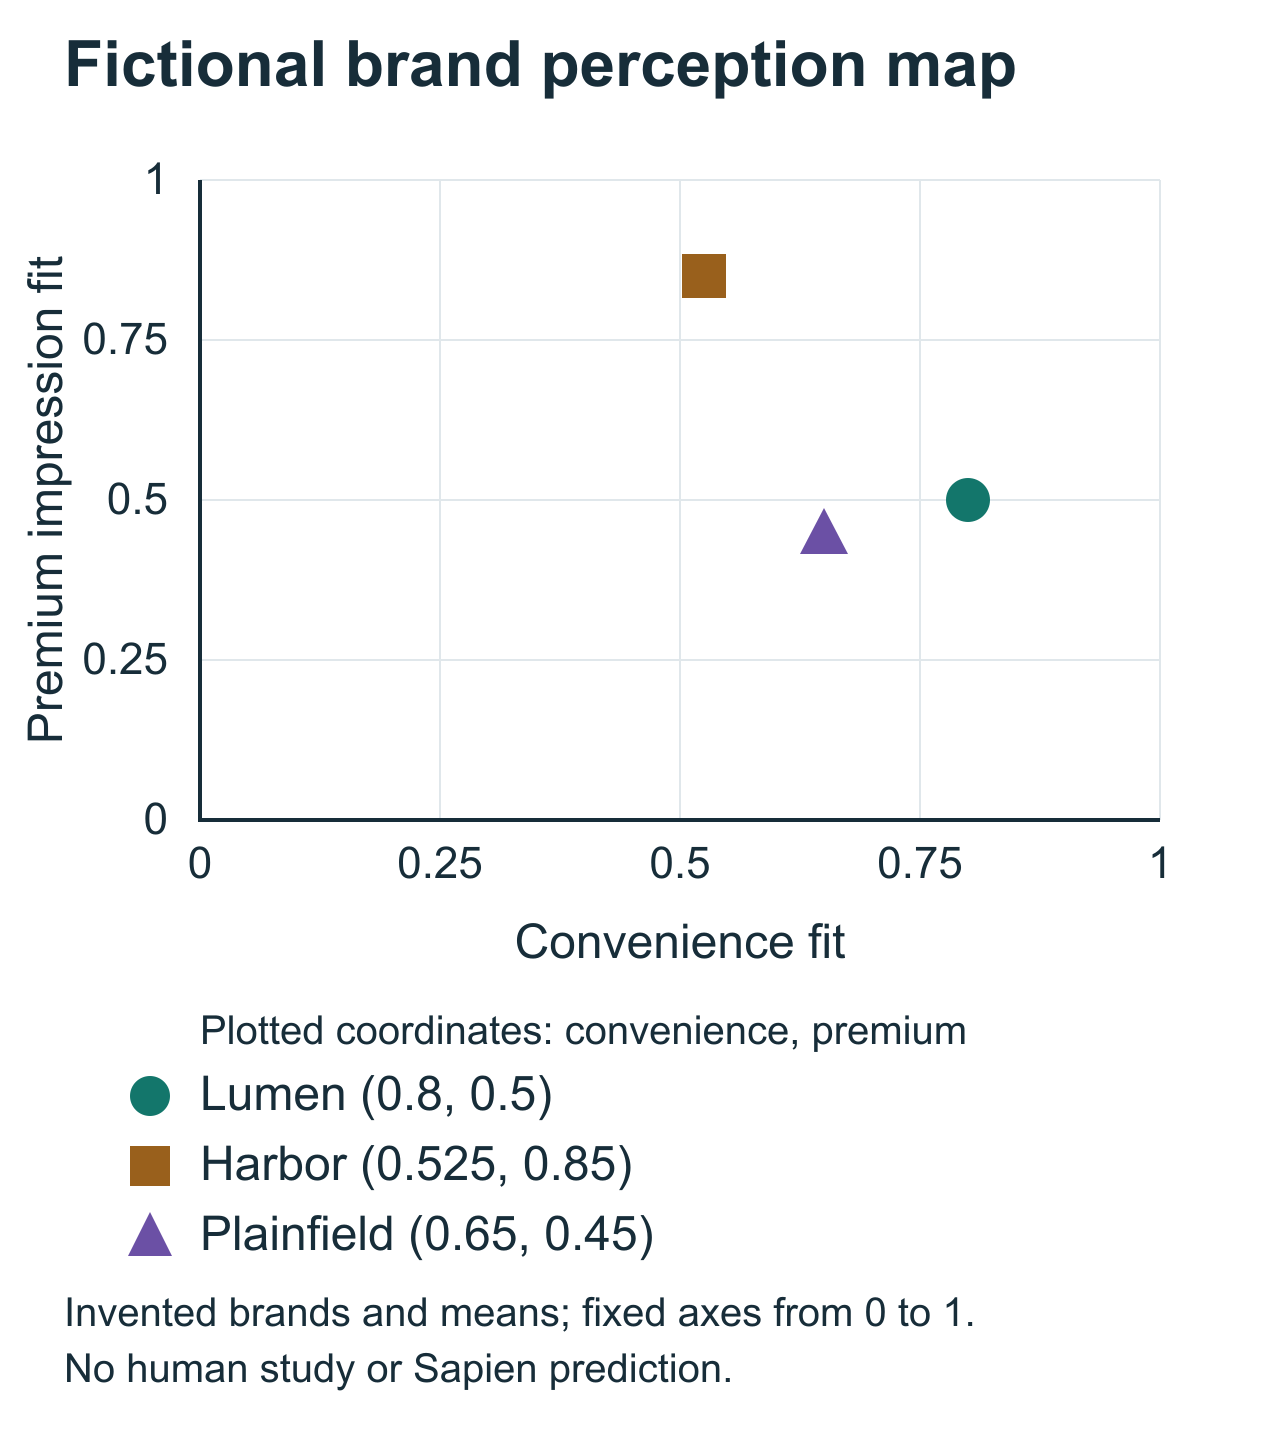
These records define a standalone fictional dataset with 100 valid ratings for each attribute and brand. The scale is 1, does not fit at all, to 5, fits extremely well. In a real study, people who don't know a brand well enough to rate it are left out of that mean and reported separately. Means and valid bases alone don't establish precision.
Use the same question, endpoints and offer version for each brand. Know who can rate it. A brand evaluated mainly by loyal users can appear stronger than one familiar to a broad mixed audience. The map should preserve that coverage question rather than imply all dots share identical evidence.
Use the copyable CSV and SVG plotting example below to reconstruct every coordinate. The SVG uses the same means and fixed axes in a simpler graphic style than the figure above.
The contrast suggests a cue test
Lumen has the highest convenience mean, 4.2, and a premium mean of 3.0. Harbor is lower on convenience at 3.1 and higher on premium at 4.4. Plainfield supplies a further category reference at 3.6 and 2.8. Those contrasts help choose what to investigate, while their causes remain unknown.
A specific question follows: can a truthful packaging cue strengthen premium meaning among the intended Lumen buyers without sacrificing their valued convenience? This preserves an existing association as a guardrail instead of treating the map as permission to move toward any empty area.
Choose a cue the product can deliver. An ingredient detail, feasible presentation or verified experience may be relevant. An attractive premium claim without a physical basis can raise an association score while creating a promise the offer fails to fulfill.
Empty space does not establish unmet demand. It may reflect low need, infeasible delivery or a missing important dimension. A brand moving a dot also need not gain customers. Associations are one part of the buying situation.
Convenience and premium need buyer definitions
Convenience can mean availability, portability, preparation or easy disposal. Premium can mean ingredients, presentation, occasion or price. Ask the audience what the terms evoke before deciding which mechanism the next cue should change.
If the team wants portable tea while respondents interpreted convenience as grocery availability, a packaging change may not address the rated meaning. Use that explanation to revise the measure or the hypothesis. A precise axis label can't fix a rating whose meaning differs from the team's intended benefit.
The axes are two attributes the team chose in advance. This map doesn't discover which dimensions organize competition. If that's your question, investigate broader buyer comparisons before selecting two axes.
Keep the same fixed scale endpoints across waves, preserving the original 1–5 ratings. If you stretch each wave between its lowest and highest brand means, unchanged ratings can appear to move because the frame has changed.
Each dot has a base and a distribution
A mean can summarize broad moderate agreement or polarized responses. Similar means need not describe similar audiences. Keep the full category distribution and meaningful segments available, especially when a cue targets one group.
Compare familiarity and knowledge exclusions. A 'don't know enough to say' answer is not a middle rating, so don't plot it as one. If one brand has many unanswerable ratings, that is a different evidence base and possibly an awareness question, rather than a reason to put its missing records at the center.
The example records contain means and valid bases, not individual distributions. They cannot produce uncertainty circles or prove a segment difference. Draw those only from appropriate actual records and analysis.
Preserve wording, sampling, weights and exclusions with the map. Those details determine whether two dots or two waves can be meaningfully compared. A visually clean chart can otherwise conceal a change in who supplied the rating.
Normalization changes the scale, not the evidence
The plot uses fixed-endpoint normalization, (mean−1)/4. Lumen becomes (0.8, 0.5); Harbor (0.525, 0.85); Plainfield (0.65, 0.45). A direct 1–5 plot shows the same ordering and source values.
Converting the fixed 1–5 scale to 0–1 changes how the same ratings are displayed. It adds no respondents or new evidence about competition. The distance between two points isn't a validated measure of how directly those brands compete. Keep the original ratings beside the coordinates so a reviewer can reconstruct every point.
Report any later movement in the original 1–5 units, alongside the meaning buyers attach to it. A higher premium rating could describe a valued taste, gift suitability or simply a higher expected price. The follow-up must identify which meaning the cue created before the team adopts the position.
Source records and a copyable plotting example
The CSV retains the original field names and all three records. Its evidence_type field is fictional_teaching_data for every row.
Complete brand-map CSV
brand,convenience_mean,premium_mean,valid_convenience_n,valid_premium_n,scale_min,scale_max,normalized_convenience,normalized_premium,evidence_type
Lumen,4.2,3.0,100,100,1,5,0.8,0.5,fictional_teaching_data
Harbor,3.1,4.4,100,100,1,5,0.525,0.85,fictional_teaching_data
Plainfield,3.6,2.8,100,100,1,5,0.65,0.45,fictional_teaching_data
Complete SVG plotting example
Copy the SVG into a plain-text document with an .svg extension to open or edit the drawing. It contains the same fixed 0–1 axes and the three coordinates shown above.
<svg xmlns="http://www.w3.org/2000/svg" width="640" height="480" viewBox="0 0 640 480" role="img" aria-labelledby="title desc">
  <title id="title">Fictional tea-brand perception map</title>
  <desc id="desc">Convenience and premium impression normalized to fixed zero-to-one scales. Fictional Lumen is 0.8 and 0.5, Harbor 0.525 and 0.85, Plainfield 0.65 and 0.45. This is a plot of declared invented means, not an estimated market model.</desc>
  <rect width="640" height="480" fill="#fff"/>
  <g font-family="Arial, sans-serif" fill="#172d39">
    <text x="70" y="26" font-size="19" font-weight="bold">Fictional brand perception map</text>
    <g stroke="#e0e7eb" stroke-width="1">
      <path d="M70 50H530M70 130H530M70 210H530M70 290H530M70 370H530"/>
      <path d="M70 50V370M185 50V370M300 50V370M415 50V370M530 50V370"/>
    </g>
    <path d="M70 50V370H530" fill="none" stroke="#172d39" stroke-width="2"/>
    <g font-size="13" text-anchor="middle">
      <text x="70" y="391">0</text><text x="185" y="391">0.25</text><text x="300" y="391">0.5</text><text x="415" y="391">0.75</text><text x="530" y="391">1</text>
      <text x="300" y="419" font-size="16">Convenience fit</text>
    </g>
    <g font-size="13" text-anchor="end">
      <text x="58" y="375">0</text><text x="58" y="295">0.25</text><text x="58" y="215">0.5</text><text x="58" y="135">0.75</text><text x="58" y="55">1</text>
    </g>
    <text x="23" y="220" font-size="16" text-anchor="middle" transform="rotate(-90 23 220)">Premium impression fit</text>
    <circle cx="438" cy="210" r="7" fill="#13766b"/>
    <text x="450" y="200" font-size="14">Lumen (0.8, 0.5)</text>
    <circle cx="311.5" cy="98" r="7" fill="#99601c"/>
    <text x="324" y="88" font-size="14">Harbor (0.525, 0.85)</text>
    <circle cx="369" cy="226" r="7" fill="#6b50a5"/>
    <text x="274" y="253" font-size="14">Plainfield (0.65, 0.45)</text>
    <text x="70" y="448" font-size="13">Invented brands and means; no human study or Vensia prediction.</text>
    <text x="70" y="467" font-size="12">Coordinates = (raw mean - 1) / 4; fixed endpoints 0 and 1.</text>
  </g>
</svg>
One feasible cue against the current presentation
Randomly assign intended buyers to the current Lumen presentation or one feasible revised cue. Hold product facts, price, exposure and other visual treatment constant unless they are deliberately part of the change. Collect unaided interpretation before the association ratings so a score can be connected to the product people imagined.
Read the premium and convenience distributions with their bases. A higher premium mean is incomplete if important buyers now imagine difficult preparation or a less portable pack. Add consideration or an appropriate choice task when deciding whether to develop the cue requires more than associations.
Define the guardrail in words and evidence before collection: which convenience meaning must survive, for whom and under what use occasion? A numerical condition can follow from the actual business requirement and design, rather than a universal percentage selected after seeing the result.
If the decision concerns what the established identity contributes to the same offer in its current category, our brand equity research guide explains how to plan that comparison.
Keep the cue only if its meaning is useful and true
Develop the cue when it strengthens the intended meaning, preserves the valued convenience and is deliverable. Revise it when premium depends on a false product inference. Reconsider the territory when the associations conflict for the audience the brand can reach.
The map supplies a hypothesis and a matched test, not a full repositioning launch decision. Keep product experience, audience evidence and commercial feasibility with the recommendation. Modeled ratings retain their grounding and validation requirements just as collected ratings retain their sampling limits.
Two related decisions follow from the map:
- Use our brand perception guide to investigate what created the current impressions.
- Use our positioning territories guide to choose the audience and lead promise before refining the cue.
Bring the current brand presentation, the cue you want to compare and the buyer question behind it. Book a demo to explore how Vensia can investigate modeled responses and help choose the next test.